Thursday's Trade Analysis:
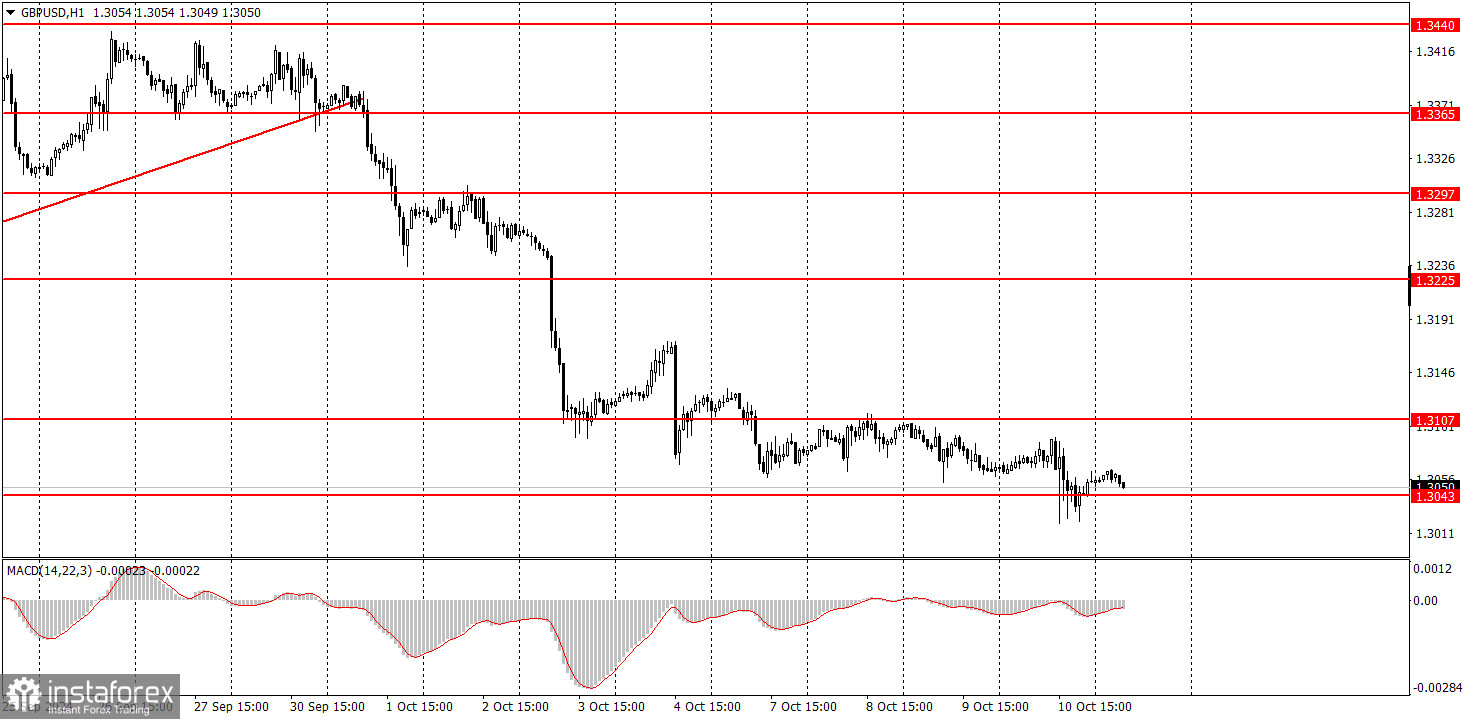
1H Chart of the GBP/USD Pair
On Thursday, the GBP/USD pair continued its gradual downward trend. The U.S. inflation report showed that prices are slowing less than expected, and core prices have even started to rise more significantly. As a result, the market quickly abandoned expectations of a dovish decision by the Federal Reserve in November, which supported the dollar. The U.S. currency experienced only a slight increase yesterday, but its overall outlook remains unchanged. It is still expected to continue growing, regardless of incoming data. This suggests that the EUR/USD pair is likely to continue falling. At the moment, a correction seems overdue and may begin abruptly, catching many by surprise. However, there are no signs of it starting yet. Today, the U.S. dollar could continue its rise unimpeded.
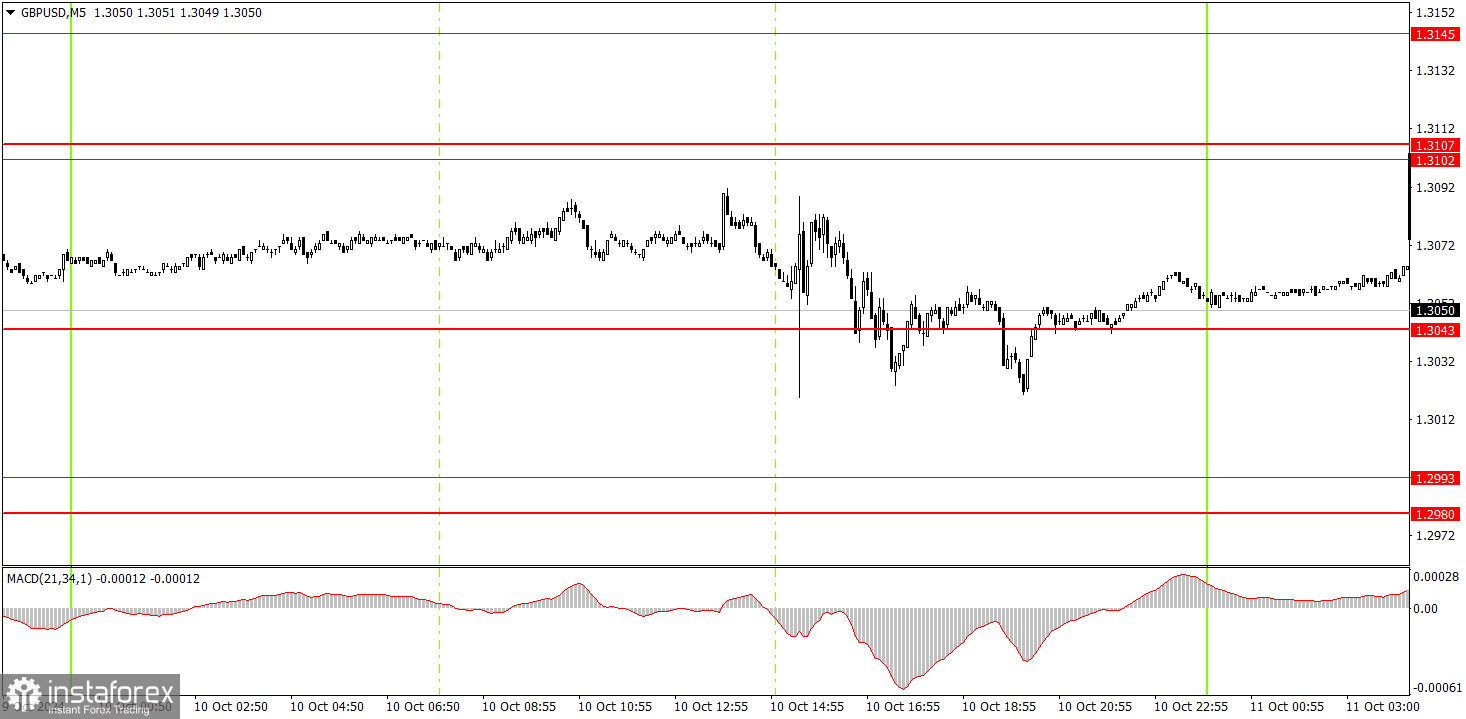
5M Chart of the GBP/USD Pair
On the 5-minute timeframe on Thursday, several trading signals were formed around the 1.3043 level. The issue was not the level itself, but the fact that an important report was released at the beginning of the U.S. session, which triggered increased volatility and significant market movements. The price swung in various directions, which is typical during the release of important statistics. Therefore, it was advisable to avoid trading the signals around the 1.3043 level, which was roughly in the middle of the trading range.
How to Trade on Friday: On the hourly timeframe, the GBP/USD pair has broken the upward trend. The U.S. dollar has begun its anticipated growth. However, caution is advised with sales, as the pair has not attempted a correction in the past two weeks. At present, there is no reason to expect the price to move into a correction. In the medium term, we fully support the view that the pair's decline is the only logical scenario.
On Thursday, the pound may continue its gradual decline, as it failed to hold above the 1.3102-1.3107 level. However, today, there could be a sharp drop in the pair during the U.S. session, followed by an even stronger rise, which could mark the start of a correction.
On the 5-minute timeframe, trading can now be conducted around the levels of 1.2913, 1.2980-1.2993, and 1.3043. Additionally, consider the levels 1.3102-1.3107, 1.3145-1.3167, 1.3225, 1.3272, 1.3365, 1.3428-1.3440, 1.3488, and 1.3537. On Friday, the UK will release reports on GDP and industrial production, which are not expected to significantly impact the market. A limited reaction of several dozen points is possible, but it is unlikely to be substantial. In the U.S., the Producer Price Index and the University of Michigan Consumer Sentiment Index will be released, which could trigger a slightly stronger reaction. Overall, the dollar is expected to continue its rise today.
Main Rules of the Trading System:
- The strength of a signal is determined by the time it takes to form (bounce or break of a level). The shorter the time, the stronger the signal.
- If two or more trades have been opened near a certain level with false signals, all subsequent signals from that level should be ignored.
- In a flat market, any pair can generate numerous false signals or none at all. In any case, it's better to stop trading at the first signs of a flat market.
- Trading positions should be opened during the European session until the middle of the American session, after which all trades should be manually closed.
- On the hourly timeframe, trading signals from the MACD indicator should only be considered when there is good volatility and a trend confirmed by a trend line or channel.
- If two levels are very close to each other (5 to 20 points apart), they should be considered as a support or resistance area.
- After moving 20 points in the right direction, a stop-loss should be set to breakeven.
What the Charts Show: Support and resistance price levels—these levels serve as targets when opening buy or sell trades. Take Profit levels can be placed near them.
Red lines—channels or trend lines that indicate the current trend and show the preferred direction for trading.
MACD indicator (14,22,3)—histogram and signal line—an auxiliary indicator that can also be used as a source of signals.
Important speeches and reports (always found in the economic calendar) can significantly influence the movement of a currency pair. Therefore, it is recommended to trade with extreme caution or exit the market during their release to avoid a sharp price reversal against the prior movement.
Beginners trading in the forex market should remember that not every trade can be profitable. Developing a clear strategy and money management is the key to long-term success in trading.