empty
28.07.2022 07:17 PM
USD/CAD: downside seems over at around 1.2819 key level

The USD/CAD pair rallied in the short term as the Dollar Index tried to rebound and recover after its massive drop. As you already know, the DXY dropped after the FOMC but the bias remains bullish, the index could turn to the upside soon.

Technically, the currency pair registered a strong drop but now it has reached a strong downside obstacle. The price action signaled that the sellers are exhausted but a new leg higher is far from being confirmed.

As you already know, the US Advance GDP and the Unemployment Claims came in worse than expected, while the Advance GDP Price Index reported better than expected data. Tomorrow, Canada is to release its Gross Domestic Product which is expected to report a 0.2% drop. On the other hand, the US Core PCE Price Index, Revised UoM Consumer Sentiment, Chicago PMI, Personal Spending, and Personal Income could bring high volatility.

USD/CAD Falling Wedge Under Development!

This image is no longer relevant

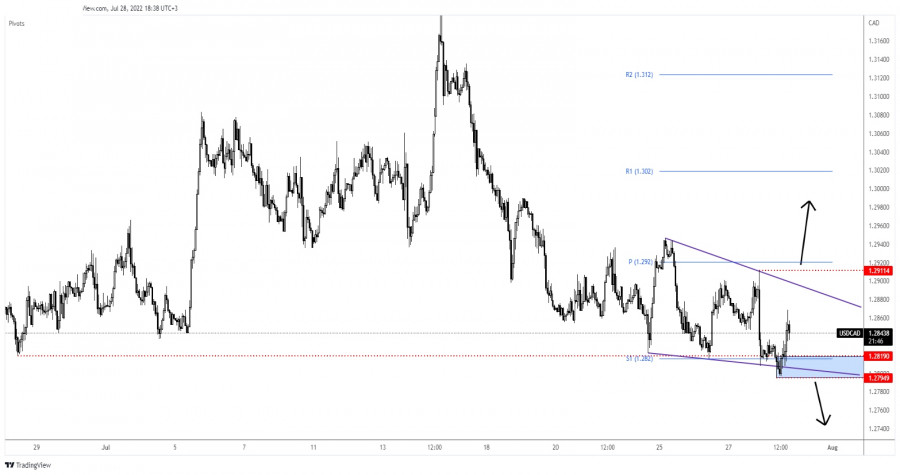
Technically, the USD/CAD pair dropped below the 1.2819 historical level, but it has failed to stay below this downside obstacle. The price action developed a potential Falling Wedge pattern. Still, this reversal formation is far from being confirmed.

In the short term, it could try to test and retest the near-term downside obstacles before trying to jump higher.

USD/CAD Outlook!

Dropping and stabilizing below the 1.2794 former low could activate more declines and could bring new short signals.

A new higher high, a valid breakout above 1.2911 activates more gains. The buyers could have a great chance to go long after making a new higher high.

Ralph Shedler,
Chuyên gia phân tích của InstaForex
© 2007-2025
Chọn khung thời gian
5
phút
15
phút
30
phút
1
giờ
4
ngày
1
ngày
1
tuần
Kiếm lợi nhuận từ những biến đổi giá của tiền điện tử với InstaForex.
Tải MetaTrader 4 và mở giao dịch đầu tiên của bạn.
  • Grand Choice
    Contest by
    InstaForex
    InstaForex always strives to help you
    fulfill your biggest dreams.
    THAM GIA CUỘC THI

Các bài báo được đề xuất

Phân Tích Kỹ Thuật Chuyển Động Giá Trong Ngày Chỉ Số Nasdaq 100, Thứ Sáu Ngày 02 Tháng 05, 2025.

Từ những gì quan sát được trên biểu đồ 4 giờ của chỉ số Nasdaq 100, chỉ báo Stochastic Oscillator đang ở trong điều kiện BÁN cắt nhau

Arief Makmur 08:04 2025-05-02 UTC+2

Tín hiệu giao dịch cho VÀNG (XAU/USD) từ ngày 1-3 tháng 5, 2025: mua trên $3,203 (200 EMA - 5/8 Murray)

Giá kim loại màu vàng có khả năng giao dịch trong khoảng từ 3,203 và có thể chạm đáy của kênh giá giảm khoảng 3,181 trong những ngày

Dimitrios Zappas 17:49 2025-05-01 UTC+2

Tín hiệu giao dịch cho EUR/USD ngày 30 tháng 4 năm 2025: bán dưới 1.1376 (21 SMA - 7/8 Murray)

Ở phiên giao dịch Mỹ sáng sớm, cặp tiền tệ EUR/USD đang giao dịch quanh mức 1.1378 trong kênh xu hướng giảm đã hình thành từ ngày 17 tháng

Dimitrios Zappas 17:37 2025-04-30 UTC+2

Dự báo Forex 30/04/2025: EUR/USD, AUD/USD, USD/JPY, Vàng, và Bitcoin

Các liên kết hữu ích: Các bài viết khác của tôi có trong phần này Khóa học InstaForex cho người mới bắt đầu Phân Tích Phổ Biến Mở tài khoản

Sebastian Seliga 16:31 2025-04-30 UTC+2

Tín hiệu giao dịch cho VÀNG (XAU/USD) cho ngày 30 tháng 4 năm 2025: mua trên $3,270 (21 SMA - 6/8 Murray)

Trong phiên giao dịch Mỹ sớm, vàng đang giao dịch quanh mức 3.384, cao hơn mức hỗ trợ chính và đang phục hồi sau khi đạt mức 3.267. Dự kiến

Dimitrios Zappas 15:07 2025-04-30 UTC+2

Dự báo Forex 29/04/2025: EUR/USD, GBP/USD, Vàng, Ethereum và Bitcoin

Liên kết hữu ích: Các bài viết khác của tôi có tại phần này Khóa học InstaForex cho người mới bắt đầu Phân Tích Phổ Biến Mở tài khoản giao

Sebastian Seliga 08:41 2025-04-30 UTC+2

Phân Tích Kỹ Thuật Về Chuyển Động Giá Trong Ngày Của Cặp Tiền Tệ Chéo AUD/JPY, Thứ Tư Ngày 30 Tháng 4, 2025.

Với sự xuất hiện của các mô hình nêm mở rộng phân kỳ và giảm dần trên biểu đồ 4 giờ của cặp tiền tệ AUD/JPY, mặc dù diễn biến

Arief Makmur 06:19 2025-04-30 UTC+2

Phân Tích Kỹ Thuật Chuyển Động Giá Trong Ngày của Các Cặp Tiền Chính USD/JPY, Thứ Tư Ngày 30 Tháng 4, 2025.

Trên biểu đồ 4 giờ của cặp tiền tệ chính USD/JPY, có thể thấy rằng chỉ báo Stochastic Oscillator hình thành mô hình Đáy Kép trong khi chuyển động

Arief Makmur 06:17 2025-04-30 UTC+2

Tín hiệu giao dịch cho VÀNG (XAU/USD) ngày 29-30 tháng 4, 2025: mua khi trên $3,310 (21 SMA - 7/8 Murray)

Chỉ báo Eagle đang cho thấy tín hiệu bán quá mức, nhưng vẫn có khả năng tiếp tục giảm, vì vậy bất kỳ sự phục hồi kỹ thuật nào cũng

Dimitrios Zappas 18:10 2025-04-29 UTC+2

Tín hiệu giao dịch cho EUR/USD cho ngày 29-30 tháng 4, 2025: bán dưới mức 1.1410 (tam giác đối xứng - 7/8 Murray)

Kế hoạch giao dịch của chúng tôi trong những giờ tới là bán dưới mức 1.1410 với các mục tiêu là 1.1370 và 1.1230. Chỉ báo "eagle" đang

Dimitrios Zappas 17:52 2025-04-29 UTC+2
Không thể nói chuyện ngay bây giờ?
Đặt câu hỏi của bạn trong phần trò chuyện.
Widget callback
 

Dear visitor,

Your IP address shows that you are currently located in the USA. If you are a resident of the United States, you are prohibited from using the services of InstaFintech Group including online trading, online transfers, deposit/withdrawal of funds, etc.

If you think you are seeing this message by mistake and your location is not the US, kindly proceed to the website. Otherwise, you must leave the website in order to comply with government restrictions.

Why does your IP address show your location as the USA?

  • - you are using a VPN provided by a hosting company based in the United States;
  • - your IP does not have proper WHOIS records;
  • - an error occurred in the WHOIS geolocation database.

Please confirm whether you are a US resident or not by clicking the relevant button below. If you choose the wrong option, being a US resident, you will not be able to open an account with InstaForex anyway.

We are sorry for any inconvenience caused by this message.