


Các mẫu thực tế
Các mẫu là các mô hình đồ họa được hình thành trong biểu đồ theo giá. Theo một trong những định đề phân tích kỹ thuật, lịch sử (chuyển động giá) thường tự lặp lại. Có nghĩa là biến động giá thường giống nhau trong các tình huống giống nhau, do đó có thể dự đoán chuyển động tiếp theo của tình huống với xác suất cao.
Actual Patterns
- All
- Double Top
- Flag
- Head and Shoulders
- Pennant
- Rectangle
- Triangle
- Triple top
- All
- #AAPL
- #AMZN
- #Bitcoin
- #EBAY
- #FB
- #GOOG
- #INTC
- #KO
- #MA
- #MCD
- #MSFT
- #NTDOY
- #PEP
- #TSLA
- #TWTR
- AUDCAD
- AUDCHF
- AUDJPY
- AUDUSD
- EURCAD
- EURCHF
- EURGBP
- EURJPY
- EURNZD
- EURRUB
- EURUSD
- GBPAUD
- GBPCHF
- GBPJPY
- GBPUSD
- GOLD
- NZDCAD
- NZDCHF
- NZDJPY
- NZDUSD
- SILVER
- USDCAD
- USDCHF
- USDJPY
- USDRUB
- All
- M5
- M15
- M30
- H1
- D1
- All
- Buy
- Sale
- All
- 1
- 2
- 3
- 4
- 5

Mô hình Đáy đôi đã được hình thành trên EURCAD M15. Đặc điểm: mức hỗ trợ 1.5761; mức kháng cự 1.5828; chiều rộng của mô hình 67 điểm
Khung thời gian M5 và M15 có thể có nhiều điểm vào lệnh sai hơn.
Open chart in a new window
Theo biểu đồ của M5, NZDCHF đã tạo thành Hình chữ nhật tăng. Loại mô hình này cho thấy sự tiếp tục xu hướng
Khung thời gian M5 và M15 có thể có nhiều điểm vào lệnh sai hơn.
Open chart in a new window
Theo biểu đồ của M15, EURNZD đã hình thành mô hình Tam giác Cân Tăng. Đường biên giới thấp hơn của mô hình chạm tọa độ 1.9161/1.9208 trong khi đường
Khung thời gian M5 và M15 có thể có nhiều điểm vào lệnh sai hơn.
Open chart in a new window
Theo biểu đồ của M30, EURNZD đã hình thành mô hình Tam giác Cân Tăng. Mô tả: Đây là mô hình của sự tiếp tục xu hướng. 1.9252 và 1.9161
Open chart in a new window
Mô hình Đáy ba đã được hình thành trên biểu đồ của công cụ giao dịch USDJPY M15. Mô hình này báo hiệu một sự thay đổi trong xu hướng
Khung thời gian M5 và M15 có thể có nhiều điểm vào lệnh sai hơn.
Open chart in a new window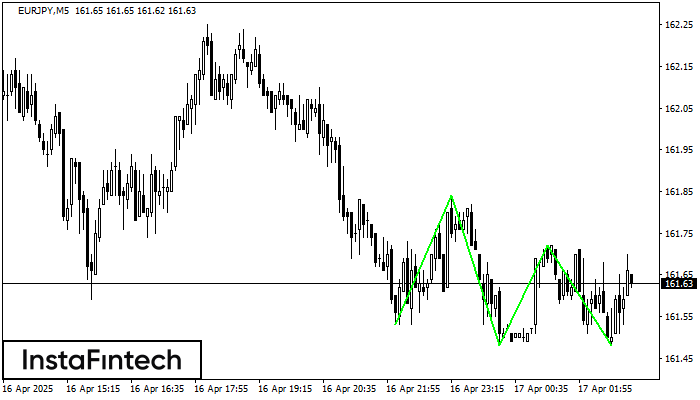
Mô hình Đáy ba đã được hình thành trên EURJPY M5. Nó có các đặc điểm sau: mức kháng cự 161.84/161.72; mức hỗ trợ 161.53/161.48; chiều rộng là 31 điểm
Khung thời gian M5 và M15 có thể có nhiều điểm vào lệnh sai hơn.
Open chart in a new window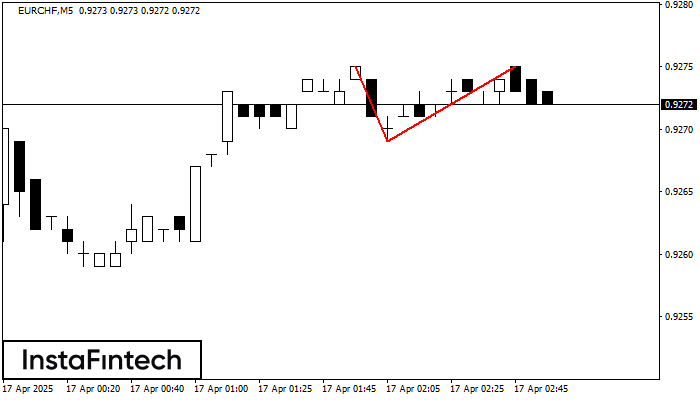
Mô hình Đỉnh đôi đã được hình thành trên EURCHF M5. Nó báo hiệu rằng xu hướng đã được thay đổi từ hướng lên thành hướng xuống
Khung thời gian M5 và M15 có thể có nhiều điểm vào lệnh sai hơn.
Open chart in a new window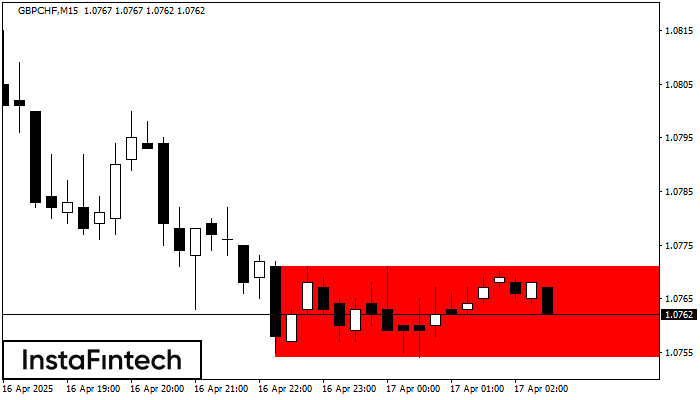
Theo biểu đồ của M15, GBPCHF đã tạo thành Hình chữ nhật giảm. Mô hình này cho thấy sự tiếp tục của xu hướng. Đường viền trên là 1.0771, đường
Khung thời gian M5 và M15 có thể có nhiều điểm vào lệnh sai hơn.
Open chart in a new window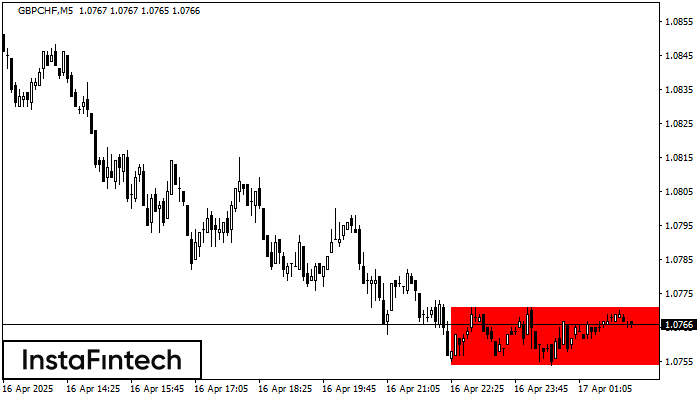
Theo biểu đồ của M5, GBPCHF đã tạo thành Hình chữ nhật giảm. Mô hình này cho thấy sự tiếp tục của xu hướng. Đường viền trên là 1.0771, đường
Khung thời gian M5 và M15 có thể có nhiều điểm vào lệnh sai hơn.
Open chart in a new window


